I spend my working life telling people to instrument their systems: measure percentiles instead of averages, pull up a trace before you start guessing, and ship signals you’ll actually act on instead of yet another dashboard nobody opens. So it was only a matter of time before I turned the same habit on the most business-critical system I own: the machine that makes my coffee.
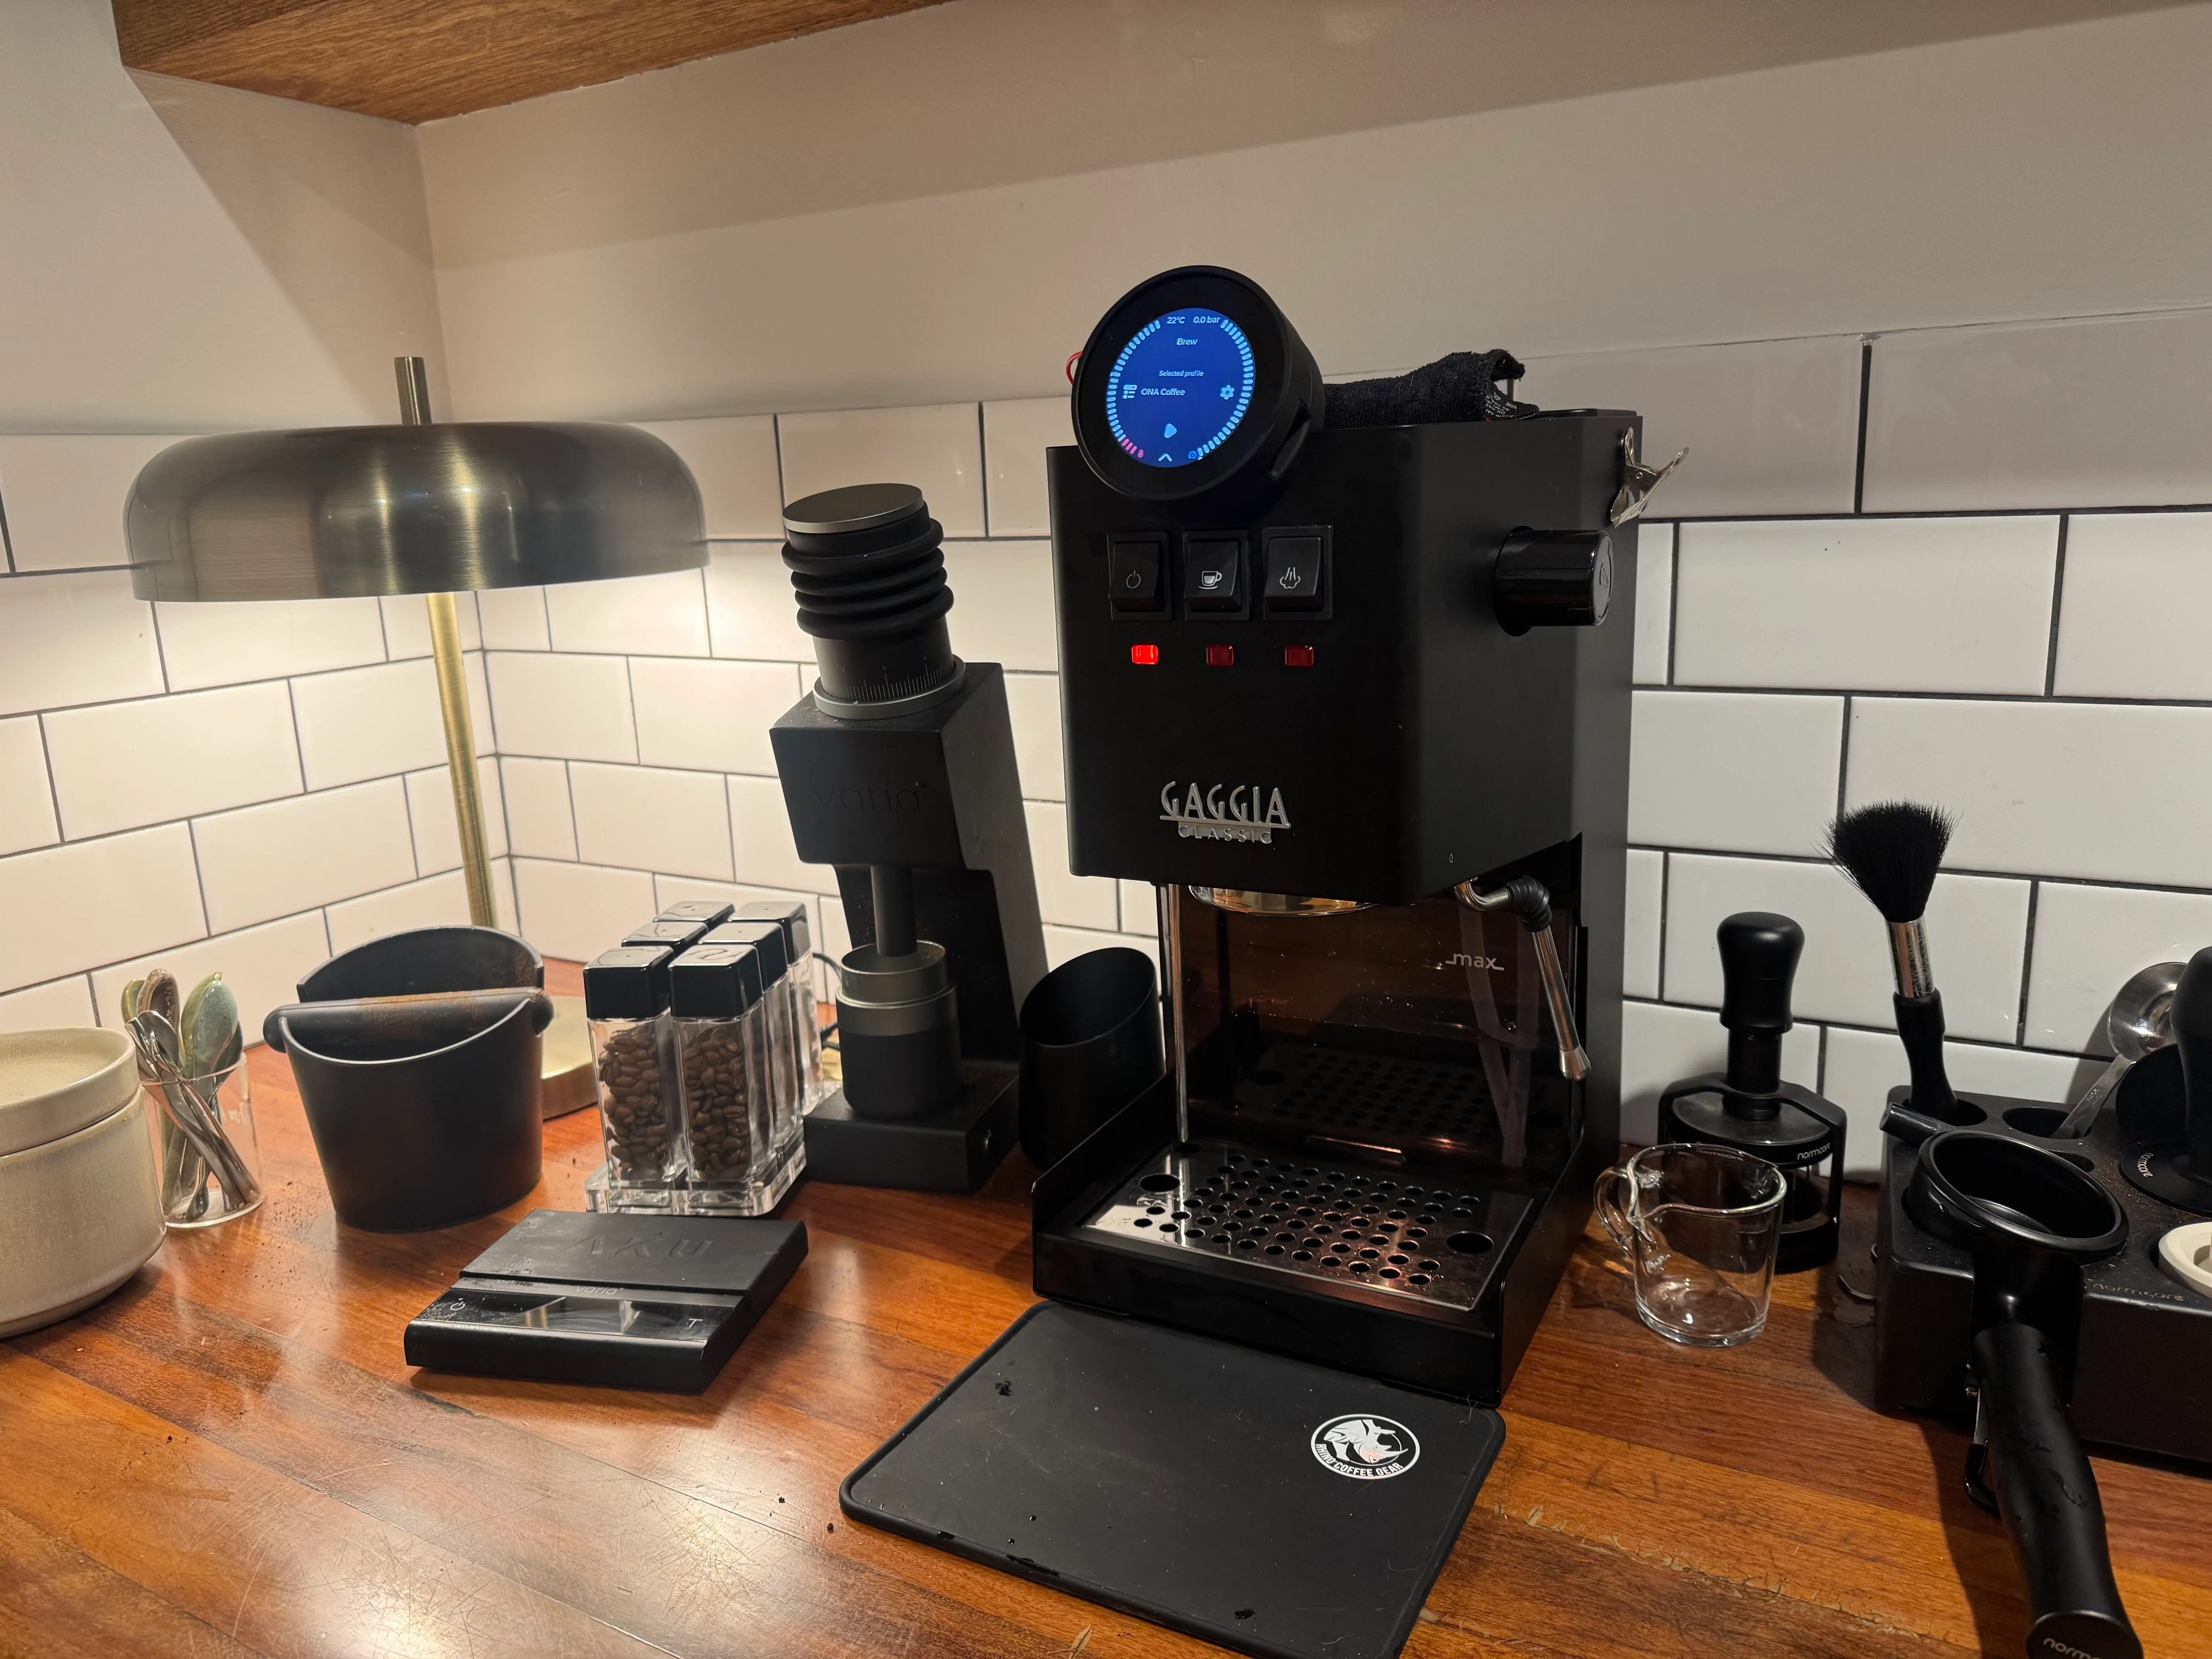
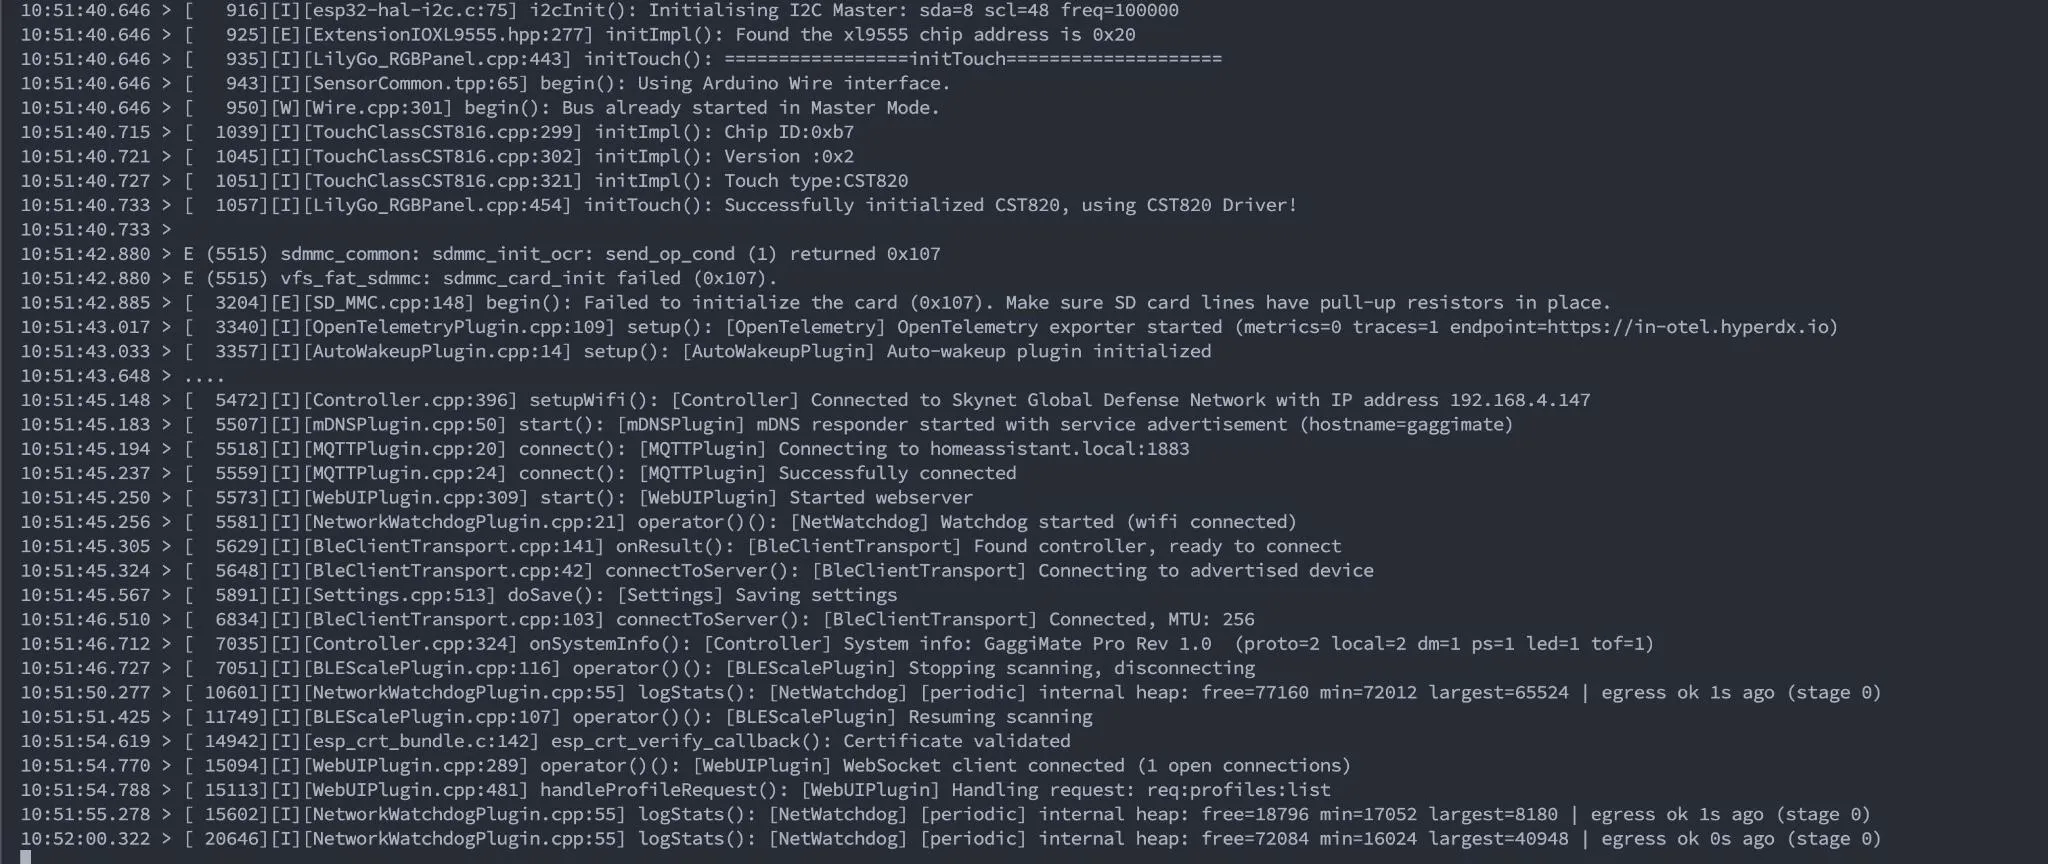
The machine is a GaggiMate, an ESP32 bolted onto a Gaggia. The traces are real, the shots are good (arguably), and the on-call rotation is me, standing in my kitchen at 7am watching a dashboard while the milk steams. This is roughly the story of how I got there, and why you can do the same to basically anything with a CPU.
Why would you do this?
Fair question, and the honest answer is that an espresso machine is a tiny industrial process, and I’ve spent years insisting that industrial processes should be observable. There’s a boiler temperature you’re fighting to hold steady, a pump pushing water through ground coffee at pressures that’d make a scuba instructor nervous, and a scale watching the weight climb. Every one of those is a number that changes over time.
Every observability backend ever built is good at numbers that change over time, so rather than reinventing a charting stack, GaggiMate ships its telemetry to whatever OTLP collector you point it at, and it hopefully ends up in an OLAP you can actually query, like ClickHouse or Honeycomb. None of them know it’s coffee; they see metrics and spans and treat them like any other workload, which is exactly the point.
What I actually built
Two signals, because as much as I do love traces, they won’t show me the flow rate trend that I would need from metrics.
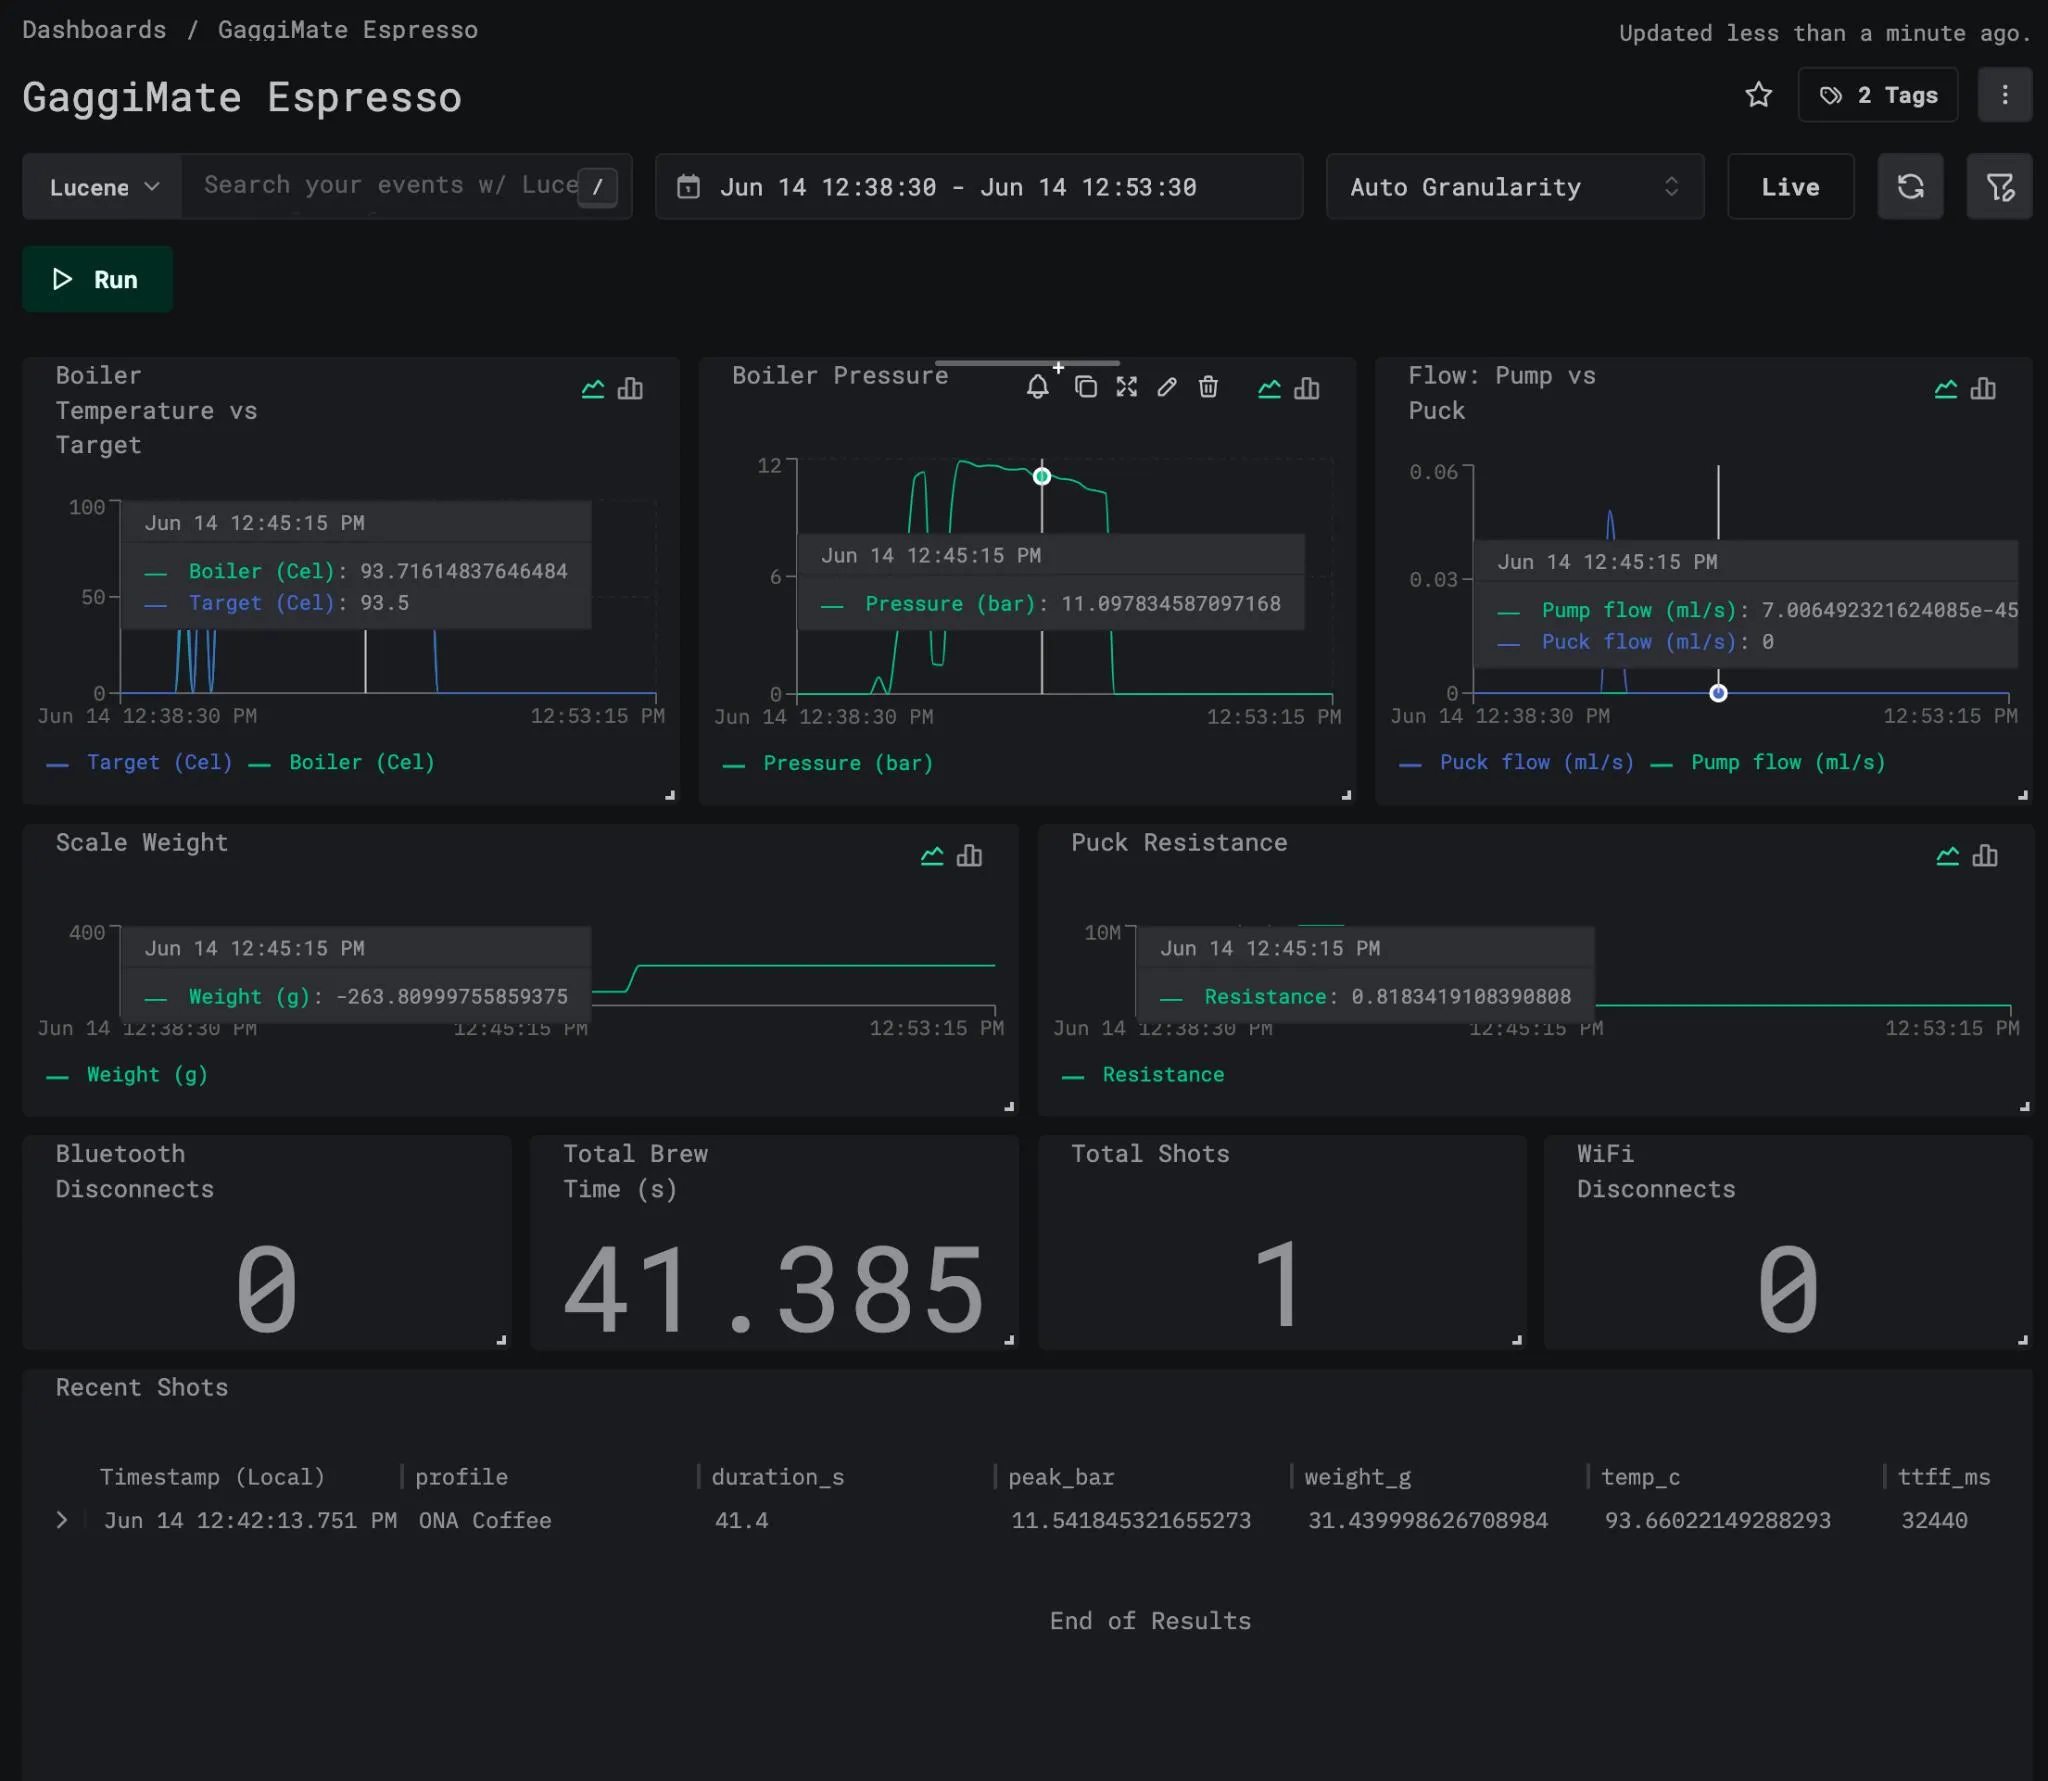
Metrics, exported every N seconds (you pick N). Some are gauges, instantaneous readings of the here-and-now:
coffee.boiler.temperature/coffee.boiler.target_temperature(Cel)coffee.boiler.pressure(bar)coffee.pump.flow/coffee.pump.puck_flow(ml/s)coffee.pump.puck_resistancecoffee.scale.weight(g), when a scale is actually connected
And some are cumulative counters, emitted as OTLP Sums: monotonic, carrying a start timestamp so the backend can compute rates instead of making me eyeball a counter.
coffee.shots.total({shot})coffee.brew.duration.total(s)coffee.water.total(ml), pump flow integrated over time, flushes and allcoffee.wifi.disconnects.total/coffee.bluetooth.disconnects.total({event})
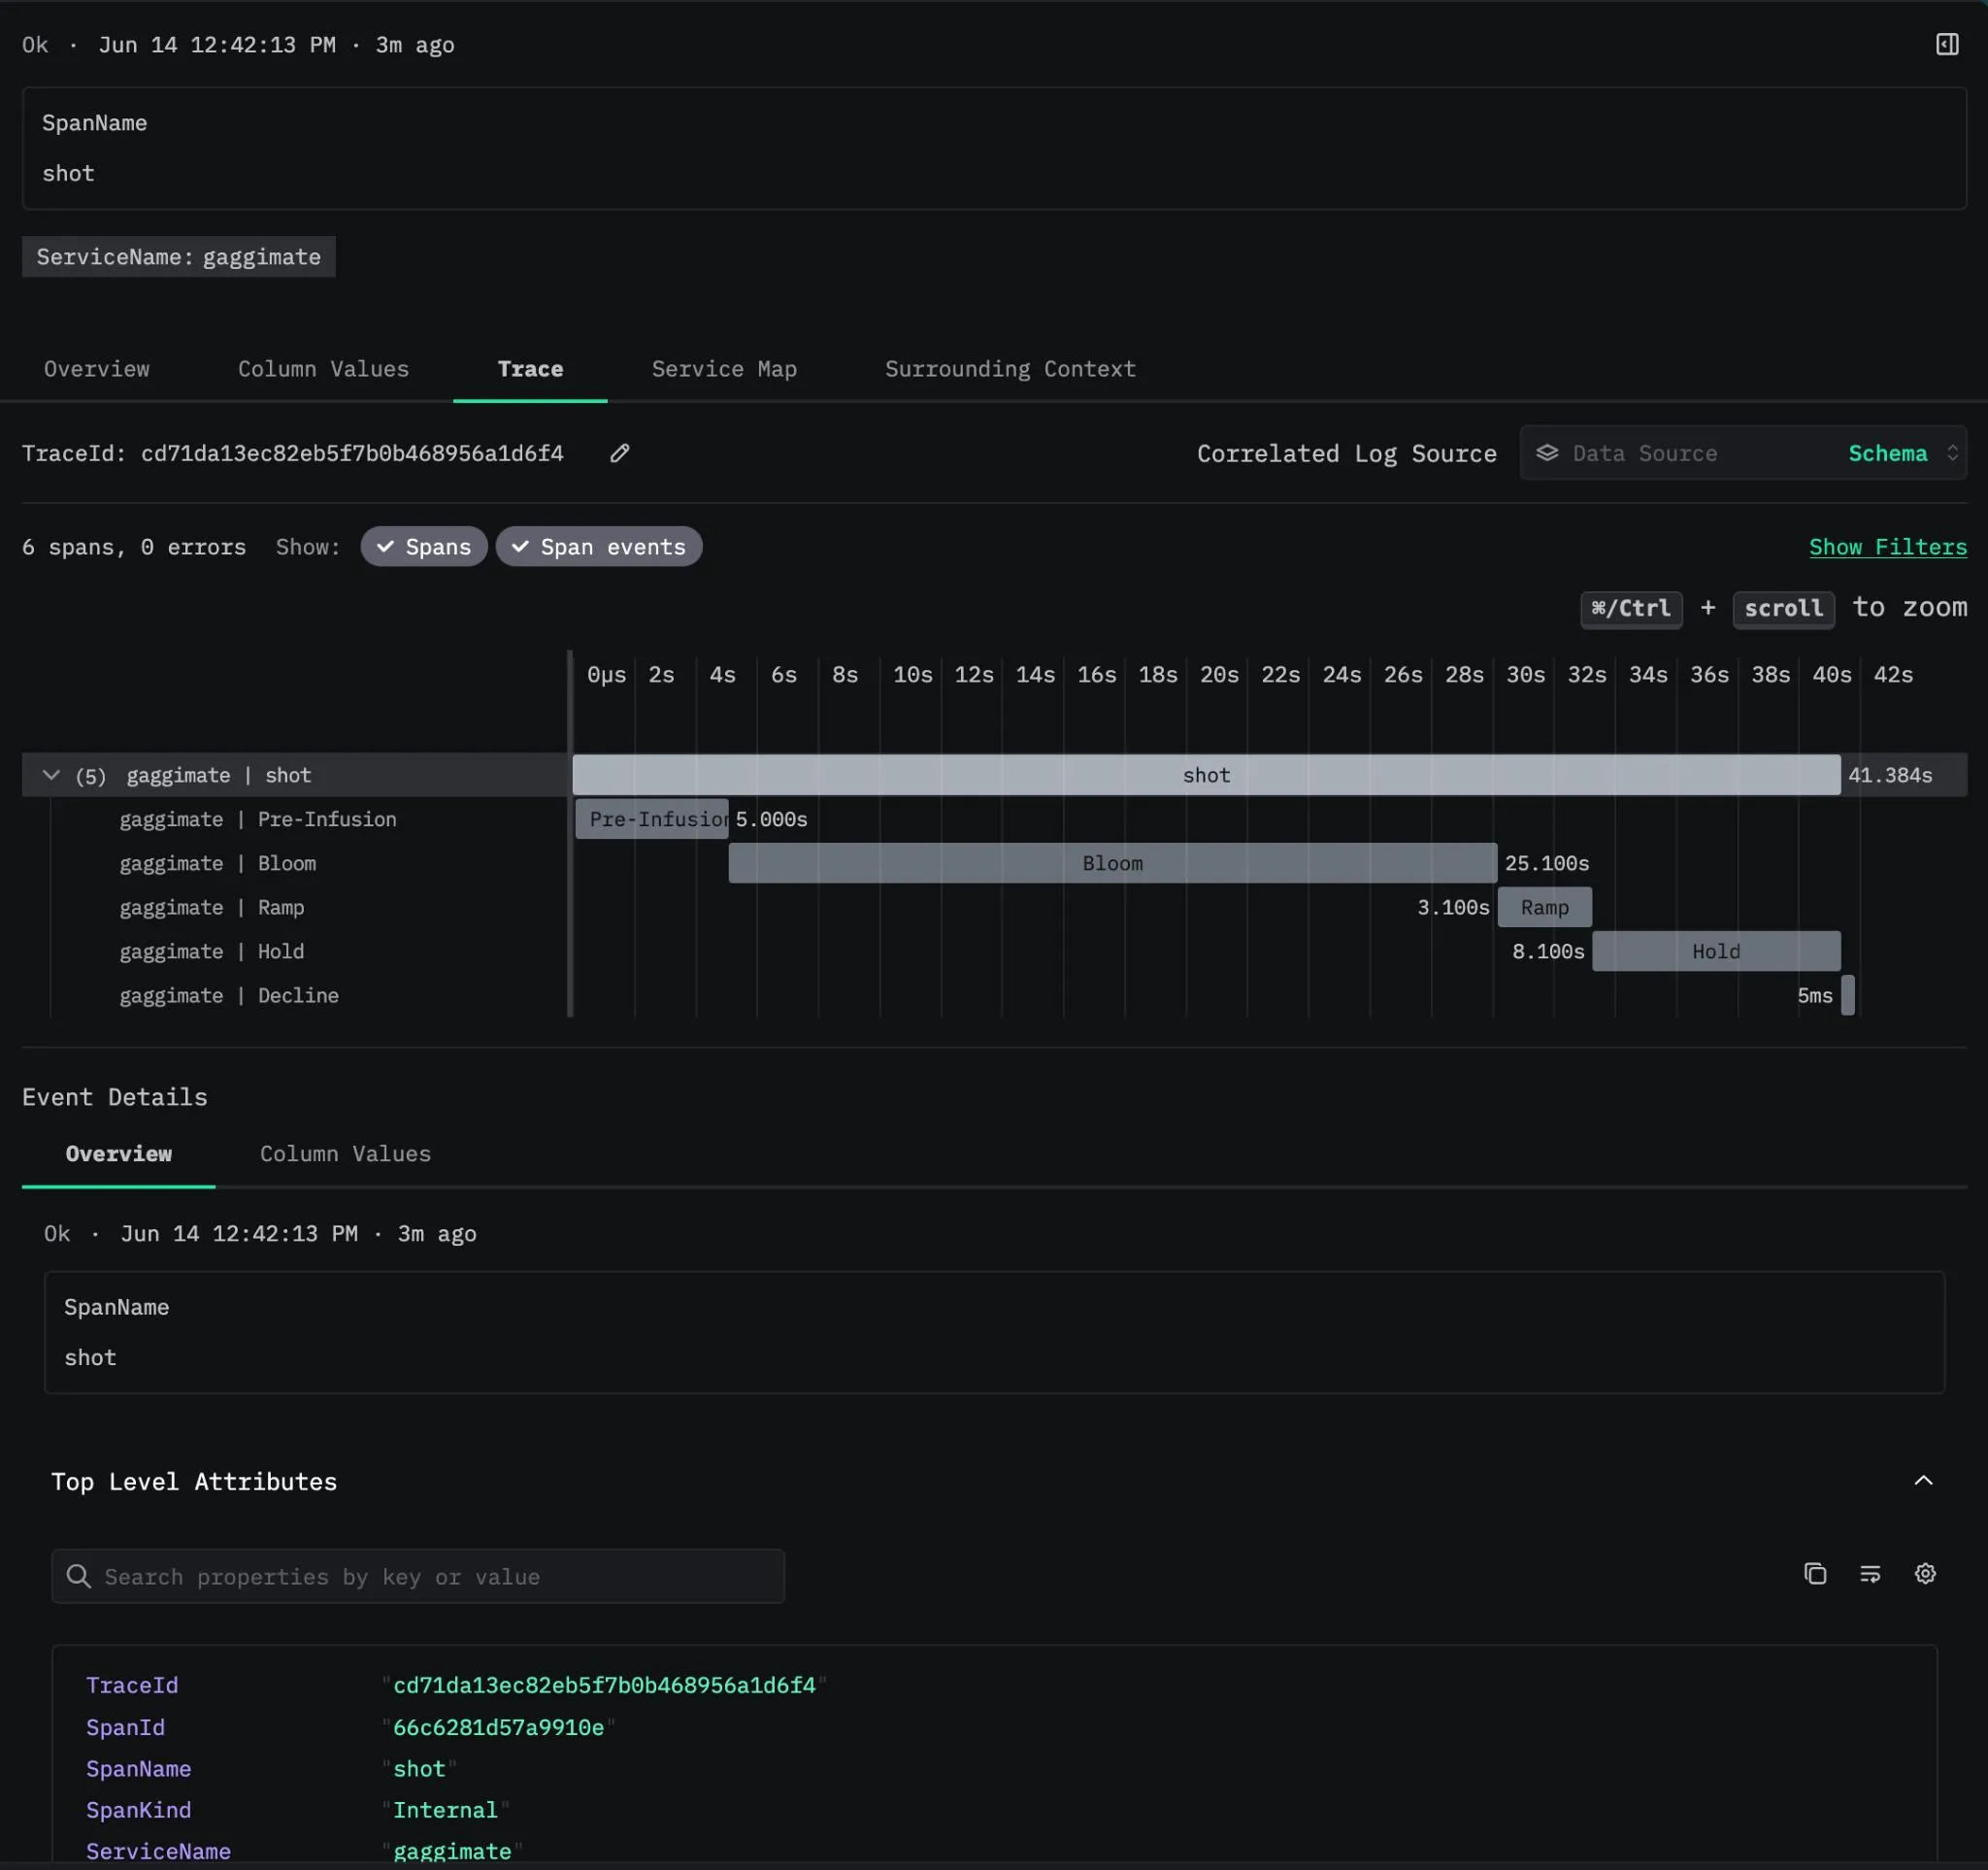
Traces, because a shot of espresso is, if you squint, a request with a strict latency budget. Every shot becomes a parent span named shot, with child spans per brew phase (preinfusion, ramp, decline, whatever wacky and elaborate profiles I’m configuring). The attributes are the sort of thing the OpenTelemetry semantic-conventions group would never sign off on, and I do not care:
coffee.shot.duration_ms = 27000coffee.shot.peak_pressure_bar = 9.1coffee.shot.peak_flow_mls = 2.4coffee.shot.final_weight_g = 36.0coffee.shot.volumetric = truecoffee.shot.target_temperature_c = 93.0coffee.shot.time_to_first_flow_ms = 8200coffee.pressure.avg_bar = 8.7coffee.flow.avg_mls = 2.1coffee.pressure.adherence_bar = 0.3coffee.flow.adherence_mls = 0.2coffee.temp.avg_c = 92.8coffee.temp.stability_c = 1.4coffee.puck.avg_resistance = 4.6coffee.puck.resistance_cv = 0.08coffee.profile.name = "Morning Panic"coffee.profile.type = "pro"The child spans get the same treatment: every brew phase carries its own coffee.phase.avg_pressure_bar and coffee.phase.avg_flow_mls next to the peaks. So I can open a trace waterfall, watch preinfusion bleed into the main pull, and see peak and average pressure and flow annotated per phase. A channeled shot looks exactly as broken in a trace view as it tastes, which is more than I can say for half the production incidents I’ve debugged.
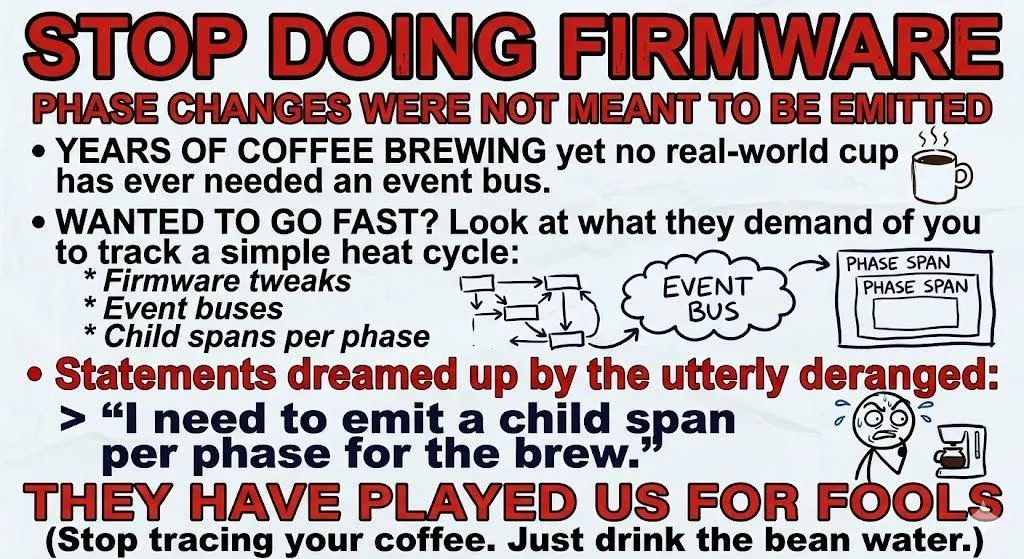
I’m aware of how this looks.
The derived numbers, computed live on-device
The rest of those attributes are the interesting ones, and they’re computed live on the device, sample by sample, while the shot is still pulling. There’s no buffering the full timeseries (we do not have the RAM capacity), just running aggregates behind the same mutex, reset at the start of each shot, summed in double so a few hundred samples don’t drift. What each one tells me:
time_to_first_flow_msis how long until liquid first crosses the puck (puck flow passes 0.5 ml/s). On a tight grind, a longer time-to-first-flow means the preinfusion is doing its job.coffee.pressure.adherence_*andcoffee.flow.adherence_*are the mean absolute error between what the profile asked for and what actually happened, the mean of|measured - target|. Each only scores a sample when there’s an active target, so a pressure-targeted phase isn’t graded on its flow tracking and vice versa. If you want to be insufferable about it, and I do, this is an SLI for espresso: the shot has an error budget and I hold it accountable.temp.stability_cis the peak-to-trough boiler swing across the shot. Small is good. Big means the PID controller and I need to have a conversation.puck.resistance_cvis the coefficient of variation of puck resistance, standard deviation over the mean. We carry the running sum and sum of squares and reconstruct the variance at the end, clamped at zero because floating-point subtraction will occasionally swear blind that variance is negative. A low CV is an even, stable puck; a high CV is the statistical fingerprint of channeling, the spread telling you what the average never would.
That last one is my favourite. I’m detecting channeling from the variance of a resistance signal, on a microcontroller, and it actually works.
Exemplars, or: the bit that ties it all together
A metric tells you something spiked; a trace tells you why. The annoying gap is getting from one to the other: you spot an ugly pressure reading at 7:04am and then go hunting for the shot it belongs to. Exemplars close that gap by stapling a representative trace_id and span_id straight onto a metric data point, so you can jump straight from a squiggly line to jumping into the trace and understanding what’s going on.
So that’s what I emit. While a shot is in flight, every live gauge data point carries an exemplar pointing at that shot’s span. The shot-driven counters (shots.total, brew.duration.total) carry one pointing at the last completed shot. Click the weird point on the temperature graph, land in the exact shot’s trace, and read off the phase breakdown and the adherence numbers.
The part where the hardware fights back
The catch with putting OpenTelemetry in anything is that the anything usually has 320KB of RAM and strong opinions about being interrupted.
The official OTLP protobufs hate microcontrollers
The real OTLP schema is spread across a dozen .proto files under opentelemetry/proto/{common,resource,metrics,trace,collector}/v1, all cross-importing each other. nanopb, the protobuf library for people whose chips are measured in kilobytes, takes one look at that include graph and gives up.
The fix feels illegal but isn’t. The protobuf wire format only cares about field numbers and wire types, not package names or file layout, so I flattened the subset I need into one self-contained otlp.proto, keeping every field number byte-for-byte identical to upstream. The collector on the other end can’t tell the difference: it gets valid OTLP and has no idea a coffee machine assembled it.
The one rule, written in the file in capital letters for the next person: keep every field number identical to upstream OTLP or collectors will silently drop your data. “Silently” is the word that eats your afternoon.
There’s a second issue. nanopb doesn’t do dynamic allocation, so every repeated field has a fixed maximum count baked in at compile time. Adding all those new shot attributes blew the old budget, so the per-span attribute cap went from 8 to 20, paid for in proper embedded fashion by dropping the span-event budget from 4 to 2. Nobody was using span events. That’s capacity planning when your entire RAM budget would fit inside a single JPEG.

TLS handshakes like to rudely interrupt things
Encoding protobuf is cheap. A HTTPS POST with a full mbedTLS handshake is not: it blocks for a few hundred milliseconds. The control loop that stops the boiler becoming a small bomb runs every 50ms. You do the maths.
So the exporter lives on its own FreeRTOS task, pinned to core 1 (core 0 is flat out with WiFi, LWIP and the TCP stack), and the control loop never waits on the network. The two threads talk through a deliberately boring interface: a mutex-guarded snapshot that the event thread keeps current (latest temp, pressure, flow, weight, and the cached service identity), and a span queue that the brew thread drops finished spans into.
The important bit: if that queue is full we drop the span rather than block the brew thread. Fail open, keep pulling shots. Nobody has ever wished their espresso machine would pause mid-extraction to retry an HTTP request. The telemetry is there to watch the coffee, not the other way around. Get that backwards on a real system and you’ve built an observability stack that takes down the thing it was meant to watch.
Time is a lie until SNTP says otherwise
OTLP timestamps are unix-nanoseconds. A fresh ESP32 thinks it’s 1970. Export before the clock syncs and you ship traces from the Nixon administration, and your backend files them somewhere you’ll never look. So there’s a guard: nothing exports until the wall clock is past 2020-09. Until then the task just sits and waits, which is the correct thing to do and the most patient I have ever been about anything.
The audit: don’t let your telemetry brick the thing it watches
Once it built and shipped data, I made myself review it the way I’d review anyone else’s change, because this code runs on the same silicon that drives a heater and a pump. The first rule of instrumentation is the one people forget the moment it gets inconvenient: your telemetry is not allowed to take down the workload. A monitoring stack that crashes the thing it monitors is worse than no monitoring at all.
The property I most wanted to prove is simple: the mutex is never held across network I/O. The export task locks only long enough to copy the snapshot, the counters and the cached identity, then unlocks before it encodes or POSTs anything. So a slow or dead collector can stall the export task all it likes, up to about 13 seconds per POST, and the control thread’s lock() never waits on it. That’s the whole ballgame. When you bolt instrumentation onto a real-time path, the lock and the blocking call must never overlap.
While reviewing it I found and fixed two things I’d genuinely shipped as crash bugs.
- A cross-thread
Stringrace that could reset the board mid-shot. The export task was readinggetSystemInfo()(the firmware version and hardware strings) andWiFi.macAddress()directly, on core 1, while the main thread can rewrite thatSystemInfowhen the controller link reconnects over BLE. Two threads touching the sameStringis a heap-pointer race, and a heap-pointer race on an ESP32 is a reboot you’ll spend a weekend failing to reproduce. The fix is the snapshot pattern again: cache the identity on the main thread (at startup and on every reconnect) and let the export task copy it under the lock. Nothing controller-owned gets read off-core anymore. - TLS stack headroom. The export task had a 12KB stack. An mbedTLS handshake plus full CA-bundle verification can spike past that, and a stack overflow doesn’t politely return an error, it resets the board. Since metrics fire every 10 seconds including mid-shot, that’s a reboot waiting for the worst possible moment. Bumped to 16KB.
The part that surprised me pleasantly: same core, same priority is fine. The control loop and the export task both sit on core 1 at priority 1, which sounds like a recipe for the network starving the heater. It isn’t, because loop() voluntarily sleeps 50ms every cycle, blocking socket calls yield (lwip parks the task), and FreeRTOS round-robins equal-priority ready tasks every 1ms tick. So even a CPU-bound handshake can’t starve the control loop by more than about a tick of jitter, and the controller board has its own hardware brew-safety timeout underneath all of this anyway. Defence in depth: the espresso doesn’t trust the firmware either.
Everything else came out bounded and boring, which is what you want from this layer. The span queue is fixed at 16 and drops on full, the encode buffer is a fixed 8KB that fails closed on overflow, the export task isn’t wired to the watchdog so a slow network can’t trip a reset, and if the buffer or mutex won’t allocate at boot the plugin disables itself instead of limping along.
None of it is clever. Clever is how you get paged, or in this case it’s how you end up debugging your coffee machine while trying to get started with your day.
Wiring it up
All of this is configured from the Web UI, because making people recompile firmware to add an auth header is user-hostile and I refuse:
- toggle Metrics and Traces independently;
- set the OTLP/HTTP endpoint (base URL only;
/v1/metricsand/v1/tracesget appended for you); - paste custom headers, one
Header: valueper line, for whatever token your SaaS collector demands; - pick the metric export interval.
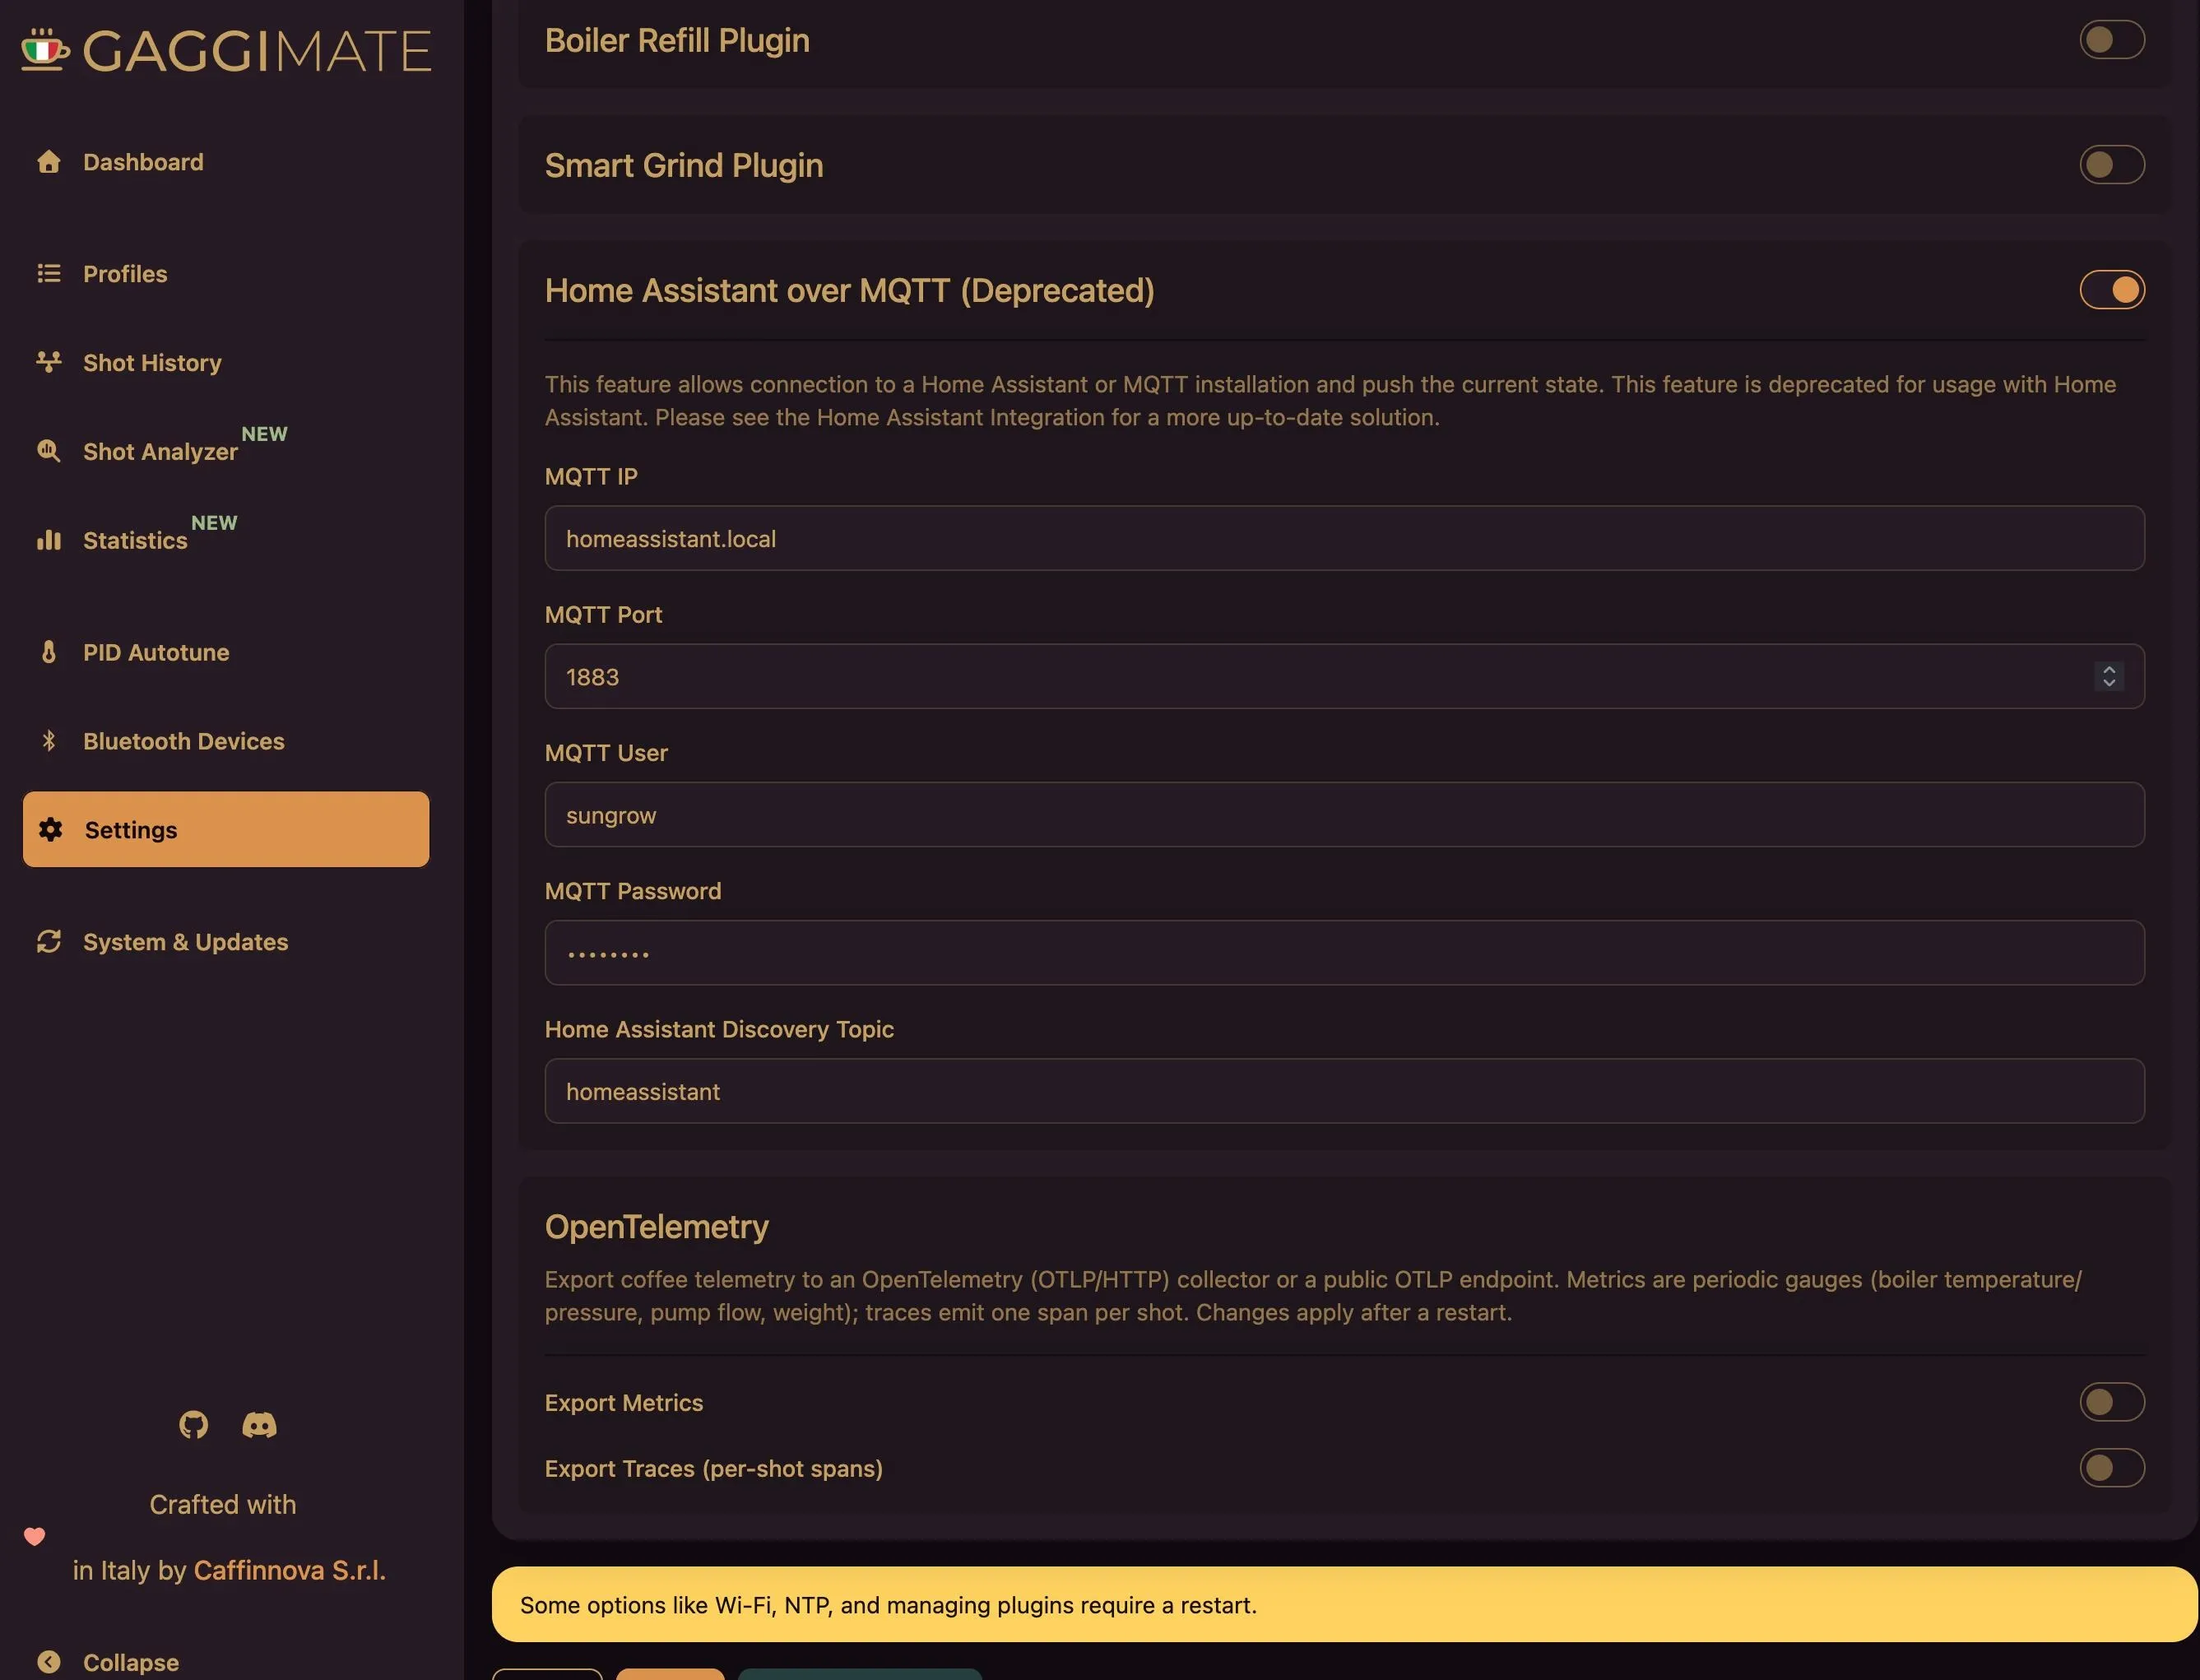
https:// endpoints just work off the same baked-in mbedTLS CA bundle the OTA updater already trusts. The plugin only registers itself if you’ve enabled a signal, so disabled means no task, no overhead, no excuses.
I also took the chance to make the OTA update source a configurable URL. Point it at your own fork’s /releases/ and you can ship your own builds over the air; leave it blank and it falls back to the official releases, because a blank text box should never brick someone’s firmware. Safe defaults, override when you need to: the same principle I bang on about with developer tooling.
So what do you actually get out of this?
TL;DR; a dashboard of my morning espresso’s pressure curve, a trace waterfall that breaks each shot into phases, and enough hard numbers that when the coffee’s bad I can prove whose fault it was. (Mine. It’s always the grind.)
I do want to mention one thing, though. People talk about OpenTelemetry like it’s either magic or strictly for sprawling microservice fleets. It’s neither: underneath, it’s a well-specified, vendor-neutral way of saying “here are some numbers and some spans.” Strip away the kilograms of SDK people pile onto it, hand-roll the wire format, respect what the hardware can actually do, and your microcontroller gets to sit in the same observability stack as everything else.
The instincts that make a production system debuggable carry straight over:
- Instrument your shit with intent.
- Keep your signals actionable.
- Never let the instrumentation endanger the workload.
You really can put OpenTelemetry in anything. The only question I had was whether the coffee would still come out. It does, and now it’s traced.
All of this lives in my GaggiMate fork on GitHub. Flash it, point it at your collector, and trace your own bean water.
Next time: hooking in an agent which “roasts” my coffee with the data it reads.